Introduction
ultibi is a free(subject to license agreement) python library by Ultima. ultibi is a framework for building Pivot Tables and Cubes, to display and drill through the key metrics for your data.
This userguide will provide examples of the functionality. We pick - Fundamental Review of the Trading Book's Standardised Approach to serve as a great usecase example.
Why to use ultibi
-
You can breakdown and drillthrough your computation
-
Everything you need for analysis: Filtering, Overriding, Adding Trades and so on.
-
Blazingly fast.
Why to use ultibi for FRTB
-
The calculation goes as per FRTB SA Paper (Note:
ultibiis not (yet) certified by ISDA. Always check the output against your own interpretation of the regulation) and aims to be fully compliant(although not certified).ultibisupports CRR2 parameter set out of the box. Switch between the two is as easy as settingjurisdictiontoCRR2orBCBS. -
ultibiis very flexible and allows you to override any of the prescribed parameters (such asgirr_delta_rho_infl_base_low) viacalc_paramsargument. This essentually means that you can define your own parameter sets as per any regulatory requirements (eg non BCBS/CRR2). This also means that you can stress test against changes in the values of the prescribed (aka hard coded by ISDA) parameters.
Installation
If you are downloading from a software repository
pip install ultibi
or if you have a .whl file
pip install *.whl
TL;DR
Although it is strongly advised to read all the chapters, this chapter consists of reproducible examples if you are looking to get up and running instantaneously.
with UI
To spin up the Cube/Pivot UI
import ultibi as ul
import polars as pl
import os

os.environ["RUST_LOG"] = "info"  # enable logs
os.environ["ADDRESS"] = "0.0.0.0:8000"  # host on this address

# Read Data
# for more details: https://pola-rs.github.io/polars/py-polars/html/reference/api/polars.read_csv.html
df = pl.read_csv("data/titanic.csv")

# Convert it into an Ultibi DataSet
ds = ul.DataSet.from_frame(df)

# By default (might change in the future)
# Fields are Utf8 (non numerics) and integers, but you can configure it
# through the config. See `Input and Data Sources` section.
# Measures are numeric columns.
ds.ui()
FX Example
import polars as pl
import ultibi as ul

pl.Config.set_tbl_rows(100)
pl.Config.set_tbl_cols(14)

# First, let's mock up a portfolio of 15 trades
# Note: we will ask ultibi to assign risk weight for us as per the regulation
# As such, we need to provide all the columns required for weights assignments,
# even if they are not used.
# fmt: off
data = {
# Optional but useful column. We will aggregate at the level of "Group"
"Group": ["Ultima"]*15,
# Delta represents both Delta and Curvature risk. Vega is for Vega only
"RiskCategory":	["Delta","Delta","Delta","Delta","Vega","Vega","Vega","Vega",
                 "Delta","Delta","Delta","Delta","Delta","Delta","Delta"],
"RiskClass": ["FX",	"FX", "FX",	"FX","FX","FX","FX","FX","FX","FX","FX","FX","FX",
              "FX","FX"],
# FX Risk Factor must be of CCY1/CCY2 format
"RiskFactor":["GBPUSD","BRLUSD","BRLUSD","JPYEUR","GBPUSD","GBPUSD","THOUSD","JPYEUR","EUREUR","EURUSD","GBPEUR","GBPUSD","EURUSD","AZNUSD","EURUSD"],
# We leave it as none because ultibi fills nans on this column with RiskFactor for FX
"BucketBCBS": [None]*15,
"BucketCRR2": [None]*15,
# RiskFactorType is not relevant to FX, but we still need to provide it
"RiskFactorType": [""]*15,
"CreditQuality": [""]*15,
# Cob and MaturityDate is not relevant to FX, but we still need to provide it
"COB": ["2023-01-30"]*15,
"MaturityDate": ["2023-01-30"]*15,
# These are our sensitivities
"PnL_Up":[1000.0,1000,1000,1000,None,None,None,None,None,None,None,None,None,None,None],
"PnL_Down":[-1000.0,-1000,-1000,-1000,None,None,None,None,None,None,None,None,None,None,None],
"SensitivitySpot":[123000,	123000,	123000,	123000, None,None,None,None,100,5,15,10,5,
                    -13.5,100],
"Sensitivity_05Y":[None,None,None,None,5000,5000,1000,None,None,None,None,None,None,None,None],
"Sensitivity_1Y":[None,None,None,None,5000,5000,None,1000,None,None,None,None,None,None,None],
"Sensitivity_3Y": [None,None,None,None,5000,5000,None,1000,None,None,None,None,None,
                    None,None],
"Sensitivity_5Y": [None,None,None,None,5000,5000,None,1000,None,None,None,None,None,
                    None,None],
"Sensitivity_10Y": [None,None,None,None,5000,5000,None,1000,None,None,None,None,None,
                    None,None],
# 21.98
"FxCurvDivEligibility":[True,True,None,None,None,None,None,None,None,None,None,None,None,None,None],
}
# fmt: on
df = pl.DataFrame(data)

# Conver our frame into FRTB dataset, opting into sqrt 2 division as per 21.88
ds = ul.FRTBDataSet.from_frame(df, build_params={"fx_sqrt2_div": "true"})
# This will add SensWeights and CurvatureWeight columns to our dataset
ds.prepare()

request = dict(
    measures=[
        ["FX DeltaCharge Low", "scalar"],
        ["FX DeltaCharge Medium", "scalar"],
        ["FX DeltaCharge High", "scalar"],
        ["FX VegaCharge Low", "scalar"],
        ["FX VegaCharge Medium", "scalar"],
        ["FX VegaCharge High", "scalar"],
        ["FX CurvatureCharge Low", "scalar"],
        ["FX CurvatureCharge Medium", "scalar"],
        ["FX CurvatureCharge High", "scalar"],
    ],
    # Break down results by Group and BucketBCBS
    groupby=["Group", "BucketBCBS"],
    # Show totals for each Group (note in this example only 1)
    totals=True,
    # Hide rows where each result is 0
    hide_zeros=True,
    calc_params={
        "jurisdiction": "BCBS",
        # Apply 21.98
        "apply_fx_curv_div": "true",
    },
)

# Execute
result = ds.compute(request)
print(result)
Input and Data Sources
Any calculation/function needs an input and our ultibi DataSet is no exception. In this chapter we go through various ways to feed data into ultibi, their pros and cons.
Ultima DataSet
First step is to create a DataSet from your data. Your data could be your portfolio for example. Think of a DataSet as a DataFrame with some special pre defined functions (eg "FX Delta Capital Charge").
Input and Data Sources
In Memory
If your data fits into process memory - use that. It's fast.
import ultibi as ul
import polars as pl

in_mem_frame = pl.read_csv(
    "./data/frtb/Delta.csv", dtypes={"SensitivitySpot": pl.Float64}
)
dsource = ul.DataSource.inmemory(in_mem_frame)
ds = ul.DataSet.from_source(dsource)
ds.prepare()  # .prepare() is only relevant to FRTB dataset currently

ds.ui()
Same would be achieved with a .from_frame() shortcut.
Your data must be a polars Dataframe. You can either do this yourself(using any of the countless IO operations supported including from_pandas and from_arrow) or use a config.
Scan
If you can't hold all your data in the process memory, you can sacrifise performance for a Scan.
import polars as pl
import ultibi as ul

# Note that the LazyFrame query must start with scan_
# and must've NOT been collected
scan = pl.scan_csv("./data/frtb/Delta.csv", dtypes={"SensitivitySpot": pl.Float64})
dsource = ul.DataSource.scan(scan)
ds = ul.DataSet.from_source(dsource)

ds.ui()
Note:
- Naturally this option will be slower, because prior to computing your measures we will need to read the relevant bits of the data into the process memory, and if relevant, call .prepare().
- Scanning involves serialisation of the Lazy Frame, and hence the python version of your
polarslib must be aligned to what we expect. At the time of writing it has to be>=0.18.7.
DataBase
Ultibi leverages on connectorx. As such all of their Sources will work eventually (Postgres, Mysql, Mariadb (through mysql protocol), Sqlite, Redshift (through postgres protocol), Clickhouse (through mysql protocol), SQL Server, Azure SQL Database (through mssql protocol), Oracle, Big Query).
Currently, Mysql has been tested to work and other DataBases will be supported in the nearest future.
import ultibi as ul
import polars as pl
from polars.type_aliases import PolarsDataType

# SQL is not very good in preserving and communicating back the schema
# Best to provide the expected schema to the cube Data Set
schema: list[tuple[str, PolarsDataType]] = [
    ("COB", pl.Utf8),
    ("TradeId", pl.Utf8),
    ("SensitivitySpot", pl.Float64),
    ("Sensitivity_025Y", pl.Float64),
    ("EXOTIC_RRAO", pl.Boolean),
    ("OTHER_RRAO", pl.Boolean),
    ("Sensitivity_05Y", pl.Float64),
    ("Sensitivity_1Y", pl.Float64),
    ("Sensitivity_2Y", pl.Float64),
    ("Sensitivity_3Y", pl.Float64),
    ("Sensitivity_5Y", pl.Float64),
    ("Sensitivity_10Y", pl.Float64),
    ("Sensitivity_15Y", pl.Float64),
    ("Sensitivity_20Y", pl.Float64),
    ("Sensitivity_30Y", pl.Float64),
    ("SensitivityCcy", pl.Utf8),
    ("CoveredBondReducedWeight", pl.Utf8),
    ("Sector", pl.Utf8),
    ("FxCurvDivEligibility", pl.Boolean),
    ("BookId", pl.Utf8),
    ("Product", pl.Utf8),
    ("Notional", pl.Float64),
    ("Desk", pl.Utf8),
    ("Country", pl.Utf8),
    ("LegalEntity", pl.Utf8),
    ("Group", pl.Utf8),
    ("RiskCategory", pl.Utf8),
    ("RiskClass", pl.Utf8),
    ("RiskFactor", pl.Utf8),
    ("RiskFactorType", pl.Utf8),
    ("CreditQuality", pl.Utf8),
    ("MaturityDate", pl.Utf8),
    ("Tranche", pl.Utf8),
    ("CommodityLocation", pl.Utf8),
    ("GirrVegaUnderlyingMaturity", pl.Utf8),
    ("BucketBCBS", pl.Utf8),
    ("BucketCRR2", pl.Utf8),
    ("GrossJTD", pl.Float64),
    ("PnL_Up", pl.Float64),
    ("PnL_Down", pl.Float64),
]

conn_uri = "mysql://%s:%s@%s:%d/%s?cxprotocol=binary" % (
    "root",
    "mysql",
    "localhost",
    3306,
    "ultima",
)

db = ul.DbInfo("frtb", "MySQL", conn_uri, schema)

source = ul.DataSource.db(db)

build_params = dict(
    fx_sqrt2_div="true",
    girr_sqrt2_div="true",
    csrnonsec_covered_bond_15="true",
    DayCountConvention="2",
    DateFormat="DateFormat",
)

ds = ul.FRTBDataSet.from_source(source, build_params=build_params)

ds.ui()
Data Source Config
In principle, you are free to enrich this structure with as many columns as you want (for example Desk, Legal Entity etc). You can either do this manually or use from_config. Check out an example with explanations of each field: datasource_config.toml.
import ultibi as ul

# You can set up a config and we will take care of
# castings, joins etc
ds = ul.FRTBDataSet.from_config_path("./data/frtb/datasource_config.toml")
print(ds.frame(None))
Validate (work in progress)
If you are missing a required column you will get a runtime error during the execuiton of your request. Alternatively, call `.validate()`` on your dataset. It checks if every required column for every availiable calculation is present. Note: If you can guarantee your particular calculation would not require the missing columns you can proceed at your own risk!
import ultibi as ul

ds = ul.FRTBDataSet.from_config_path("./data/frtb/datasource_config.toml")
try:
    ds.validate()
except ul.NoDataError as e:
    print(
        "One of key columns is missing. Be carefull if you wish to proceed "
        "without it. Error: ",
        e,
    )
print("Complete")
FRTB SA - Input format
In case of FRTB SA the input is your portfolio sensitivities at trade level. Currently expected format for the sensitivities is like this: Delta.csv. This format is very similar to the industry standard CRIF. Coming soon full CRIF support. As you can see, this file is your Sensitivities at Trade-RiskFactor-Tenor level.
In our examples we will also be using an optional hierarchies file hms.csv. Hierarchies simply define which Book belongs to where in terms of Business and/or Legal structure (eg which Desk or Legal Entity).
Finally, we need TradeAttributes.csv. It is similar to our Delta Sensis but the data here is at Trade level only. Ie Notional, Product/Derivative Type, RRAO Flags etc etc.
Defenitions
Note that the FRTB SA Paper actually well defines what a "RiskFactor" is and the formulas for "Sensitivities". See paragraphs 21.8-21.19 and 21.19-21.26 respectively.
Expected Columns Explanation - Risk
Table below will outline which columns are expected, the useage and meaning behind them. This table might get outdated. Always check Delta.csv.
| ColumnName | Expected for Weights Assignments | Expected for Calculation (past weights/scailing assignments) | Restrictions on values | Where used | Explanation |
|---|---|---|---|---|---|
| COB | Y | N | N | Used with MaturityDate to assign DRC Scailing Factor | |
| TradeId | N | Y | N | RRAO | |
| RiskCategory | Y | Y | Delta or Vega | All Risk Calculations | Note: Curvature goes under Delta |
| RiskClass | Y | Y | DRC_Sec_nonCTP/DRC_nonSec/CSR_Sec_nonCTP/Commodity/CSR_Sec_CTP/CSR_nonSec/Equity/FX/GIRR | All Risk Calculations(except RRAO) | |
| RiskFactor | Y | Y | All Risk Calculations(except RRAO) | Different meaning depending on RiskClass. See Delta.csv for correct value for your particular RiskClass. Note: for FX convention used XXXCCY where CCY is your reporting currency. Parameter reporting_ccy will filter out all lines where CCY doesn't match it's value. For jurisdiction BCBS XXXUSD only will be used (unless overriden with reporting_ccy), and similarly XXXEUR for CRR2. | |
| RiskFactorType | Y | Y | See Delta.csv | All Risk Calculations(except RRAO) | Note: Different meaning depending on RiskClass. See Delta.csv for correct value for your particular RiskClass. |
| CreditQuality | N | DRC nonSec and DRC Sec nonCTP | For DRC Sec nonCTP Joined with RiskFactorType with _ and then assigned via the table below. For DRC nonSec see respective table | ||
| MaturityDate | Y | N | Used with COB to assign DRC Scailing Factor | ||
| Tranche | Y | DRC_Sec_nonCTP | |||
| CommodityLocation | Y | Commodity Delta | |||
| GirrVegaUnderlyingMaturity | Y | GIRR Vega | |||
| BucketBCBS | Y | See Delta.csv | All Risk Calculations(except RRAO) | Be careful, refer to Delta.csv Note: For FX if not provided will be derived using RiskFactor | |
| BucketCRR2 | Y(if opt in CRR2) | See Delta.csv | Note: Present because some CSR buckets are different between BCBS and CRR2 | ||
| GrossJTD | Y | ||||
| PnL_Up | Y | ||||
| PnL_Down | Y | ||||
| SensitivitySpot | Y | ||||
| Sensitivity_025Y | Y | ||||
| Sensitivity_05Y | Y | For Vega used as Option Maturity Tenor. For Delta as Risk Factor Tenor | |||
| Sensitivity_1Y | Y | For Vega used as Option Maturity Tenor. For Delta as Risk Factor Tenor | |||
| Sensitivity_2Y | Y | ||||
| Sensitivity_3Y | Y | For Vega used as Option Maturity Tenor. For Delta as Risk Factor Tenor | |||
| Sensitivity_5Y | Y | For Vega used as Option Maturity Tenor. For Delta as Risk Factor Tenor | |||
| Sensitivity_10Y | Y | For Vega used as Option Maturity Tenor. For Delta as Risk Factor Tenor | |||
| Sensitivity_15Y | Y | ||||
| Sensitivity_20Y | Y | ||||
| Sensitivity_30Y | Y | ||||
| CoveredBondReducedWeight | Y(if you opted in via config) | N | Y or N | ||
| FxCurvDivEligibility | Y | Y or N |
Expected Columns Explanation - Trade attributes
| ColumnName | Expected for Weights Assignments | Expected for Calculation (past weights/scailing assignments) | Restrictions on values | Where used | Explanation |
|---|---|---|---|---|---|
| TradeId | N | Y | N | RRAO | |
| BookId | N | N | Not required. We use it to join hms.csv | ||
| EXOTIC_RRAO | N | Y | RRAO | ||
| OTHER_RRAO | N | Y | RRAO | ||
| Notional | N | Y | RRAO |
DRC Sec nonCTP - CreditQiality+_+RiskFactorType Weights
| CreditQuality+_+RiskFactorType | DRC Sec nonCTP Weight |
|---|---|
| AAA_SENIOR | 1.2 |
| AA+_SENIOR | 1.2 |
| AA_SENIOR | 2 |
| AA-_SENIOR | 2.4 |
| A+_SENIOR | 3.2 |
| A_SENIOR | 4 |
| A-_SENIOR | 4.8 |
| BBB+_SENIOR | 6 |
| BBB_SENIOR | 7.2 |
| BBB-_SENIOR | 9.6 |
| BB+_SENIOR | 11.2 |
| BB_SENIOR | 12.8 |
| BB-_SENIOR | 16 |
| B+_SENIOR | 20 |
| B_SENIOR | 24.8 |
| B-_SENIOR | 30.4 |
| CCC+_SENIOR | 36.8 |
| CCC_SENIOR | 36.8 |
| CCC-_SENIOR | 36.8 |
| D_SENIOR | 100 |
| UNDERATD_SENIOR | 100 |
| OTHER_SENIOR | 100 |
| AAA_JUNIOR | 1.2 |
| AA+_JUNIOR | 1.2 |
| AA_JUNIOR | 2.4 |
| AA-_JUNIOR | 3.2 |
| A+_JUNIOR | 4.8 |
| A_JUNIOR | 6.4 |
| A-_JUNIOR | 9.6 |
| BBB+_JUNIOR | 13.6 |
| BBB_JUNIOR | 17.6 |
| BBB-_JUNIOR | 26.4 |
| BB+_JUNIOR | 37.6 |
| BB_JUNIOR | 49.6 |
| BB-_JUNIOR | 60 |
| B+_JUNIOR | 72 |
| B_JUNIOR | 84 |
| B-_JUNIOR | 90.4 |
| CCC+_JUNIOR | 100 |
| CCC_JUNIOR | 100 |
| CCC-_JUNIOR | 100 |
| D_JUNIOR | 100 |
| UNDERATD_JUNIOR | 100 |
| OTHER_JUNIOR | 100 |
| A-1_JUNIOR | 1.2 |
| A-1_SENIOR | 1.2 |
| P-1_JUNIOR | 1.2 |
| P-1_SENIOR | 1.2 |
| A-2_JUNIOR | 4 |
| A-2_SENIOR | 4 |
| P-2_JUNIOR | 4 |
| P-2_SENIOR | 4 |
| A-3_JUNIOR | 8 |
| A-3_SENIOR | 8 |
| P-3_JUNIOR | 8 |
| P-3_SENIOR | 8 |
| UNDERATD_JUNIOR | 100 |
| UNDERATD_SENIOR | 100 |
| AAA_NONSENIOR | 1.2 |
| AA+_NONSENIOR | 1.2 |
| AA_NONSENIOR | 2.4 |
| AA-_NONSENIOR | 3.2 |
| A+_NONSENIOR | 4.8 |
| A_NONSENIOR | 6.4 |
| A-_NONSENIOR | 9.6 |
| BBB+_NONSENIOR | 13.6 |
| BBB_NONSENIOR | 17.6 |
| BBB-_NONSENIOR | 26.4 |
| BB+_NONSENIOR | 37.6 |
| BB_NONSENIOR | 49.6 |
| BB-_NONSENIOR | 60 |
| B+_NONSENIOR | 72 |
| B_NONSENIOR | 84 |
| B-_NONSENIOR | 90.4 |
| CCC+_NONSENIOR | 100 |
| CCC_NONSENIOR | 100 |
| CCC-_NONSENIOR | 100 |
| D_NONSENIOR | 100 |
| UNDERATD_NONSENIOR | 100 |
| OTHER_NONSENIOR | 100 |
| A-1_NONSENIOR | 1.2 |
| P-1_NONSENIOR | 1.2 |
| A-2_NONSENIOR | 4 |
| P-2_NONSENIOR | 4 |
| A-3_NONSENIOR | 8 |
| P-3_NONSENIOR | 8 |
| UNDERATD_NONSENIOR | 100 |
| D_NONSENIOR | 100 |
| AAA_SUBORDINATE | 1.2 |
| AA+_SUBORDINATE | 1.2 |
| AA_SUBORDINATE | 2.4 |
| AA-_SUBORDINATE | 3.2 |
| A+_SUBORDINATE | 4.8 |
| A_SUBORDINATE | 6.4 |
| A-_SUBORDINATE | 9.6 |
| BBB+_SUBORDINATE | 13.6 |
| BBB_SUBORDINATE | 17.6 |
| BBB-_SUBORDINATE | 26.4 |
| BB+_SUBORDINATE | 37.6 |
| BB_SUBORDINATE | 49.6 |
| BB-_SUBORDINATE | 60 |
| B+_SUBORDINATE | 72 |
| B_SUBORDINATE | 84 |
| B-_SUBORDINATE | 90.4 |
| CC+_SUBORDINATE | 100 |
| CC_SUBORDINATE | 100 |
| CC-_SUBORDINATE | 100 |
| D_SUBORDINATE | 100 |
| UNDERATD_SUBORDINATE | 100 |
| OTHER_SUBORDINATE | 100 |
| A-1_SUBORDINATE | 1.2 |
| P-1_SUBORDINATE | 1.2 |
| A-2_SUBORDINATE | 4 |
| P-2_SUBORDINATE | 4 |
| A-3_SUBORDINATE | 8 |
| P-3_SUBORDINATE | 8 |
| UNDERATD_SUBORDINATE | 100 |
| D_SUBORDINATE | 100 |
DRC nonSec - BCBS CreditQiality Weights
| CreditQuality | WeightBCBS |
| AAA | 0.005 |
| AA | 0.02 |
| A | 0.03 |
| BBB | 0.06 |
| BAA | 0.06 |
| BB | 0.15 |
| BA | 0.15 |
| B | 0.3 |
| CCC | 0.5 |
| CAA | 0.5 |
| CA | 0.5 |
| UNRATED | 0.15 |
| NORATING | 0.15 |
| DEFAULTED | 1 |
| CreditQuality | WeightCRR2 |
| AAA | 0.005 |
| AA | 0.005 |
| A | 0.03 |
| BBB | 0.06 |
| BAA | 0.06 |
| BB | 0.15 |
| BA | 0.15 |
| B | 0.3 |
| CCC | 0.5 |
| CAA | 0.5 |
| CA | 0.5 |
| UNRATED | 0.15 |
| NORATING | 0.15 |
| DEFAULTED | 1 |
Define your own Measures
One of the most powerful features of this Cube is the fact that you can define you own measures/calculations.
Please read the this article for details.
There are two kinds of Calculators:
-
Standard Calculator returns a polars expression. Use this when you can.
-
Custom Calculator returns a Polars Series. It's flexible but is slower due to the code executing in
Pythonand therefore locking the GIL.
There are two kinds of Measures:
- BaseMeasure executed within .filter().groupby().agg() context.
- DependantMeasure executed within .with_columns() context, but after underlying BaseMeasures were executed (in their respective context).
Example
Note 1: In this example the kwargs are parameters will be passed to your function through the request. See the chapter on Calc Params
Note 2: make sure your function signatures are exactly as per the example
import ultibi as ul
import polars as pl
import os

os.environ["RUST_LOG"] = "info"  # enable logs
os.environ["ADDRESS"] = "0.0.0.0:8000"  # host on this address

# Read Data
# for more details: https://pola-rs.github.io/polars/py-polars/html/reference/api/polars.read_csv.html
df = pl.read_csv("./data/titanic.csv")

# Let's add some Custom/Bespoke Calculations to our UI


# Standard Calculator
def survival_mean_age(kwargs: dict[str, str]) -> pl.Expr:
    """Mean Age of Survivals
    pl.col("survived") is 0 or 1
    pl.col("age") * pl.col("survived") - age of survived person, otherwise 0
    pl.col("survived").sum() - number of survived
    """
    return pl.col("age") * pl.col("survived") / pl.col("survived").sum()


# Also a Standard Calculator
def example_dep_calc(kwargs: dict[str, str]) -> pl.Expr:
    return pl.col("SurvivalMeanAge_sum") + pl.col("SouthamptonFareDivAge_sum")


# When we need more involved calculations we go for a Custom Calculator
def custom_calculator(srs: list[pl.Series], kwargs: dict[str, str]) -> pl.Series:
    """
    Southampton Fare/Age*multiplier
    """
    df = pl.DataFrame({"age": srs[0], "fare": srs[1], "e": srs[2]})
    # Add Indicator Column for Southampton
    df = df.with_columns(pl.when(pl.col("e") == "S").then(1).otherwise(0).alias("S"))
    multiplier = float(kwargs.get("multiplier", 1))
    res = df["S"] * df["fare"] / df["age"] * multiplier
    return res


# inputs for the custom_calculator srs param
inputs = ["age", "fare", "embarked"]
# We return Floats
res_type = pl.Float64
# We return a Series, not a scalar (which otherwise would be auto exploded)
returns_scalar = False

measures = [
    ul.BaseMeasure(
        "SouthamptonFareDivAge",
        ul.CustomCalculator(custom_calculator, res_type, inputs, returns_scalar),
        # (Optional) - we are only interested in Southampton, so
        # unless other measures requested we might as well filter
        # for Southampton only
        # However, if if multiple measures requested, their
        # precompute_filters will be joined as OR.
        [[ul.EqFilter("embarked", "S")]],
        # PARAMS tab of the UI
        calc_params=[ul.CalcParam("mltplr", "1", "float")],
    ),
    ul.BaseMeasure(
        "SurvivalMeanAge",
        ul.StandardCalculator(survival_mean_age),
        aggregation_restriction="sum",
    ),
    ul.DependantMeasure(
        "A_Dependant_Measure",
        ul.StandardCalculator(example_dep_calc),
        [("SurvivalMeanAge", "sum"), ("SouthamptonFareDivAge", "sum")],
    ),
]

# Convert it into an Ultibi DataSet
ds = ul.DataSet.from_frame(df, bespoke_measures=measures)

ds.ui()
Backend Calculation
In the following chapter we describe what's happening under the hood of our UI Pivot table. If you are only using the UI, then you don't really need to understand this. Yet, we recommend you go through it.
Assign Weights/Prepare
Currently this section only applies to FRTBDataSet. In the future python users will be able to define their own, custom prepare functions too.
Prepare is a fixed calculation which happens with every request for scans/db DataSources. For InMemory it happens only when you call .prepare().
from_config() call .prepare() depending on source_type.
A good usecase for that is to assign weights column to your data, as per FRTB regulation for example. Make sure you assign weights before doing any computations:
# TODO scan here to demonstrate prepare

import polars as pl
import ultibi as ul

# Note: sometimes Polars needs abit of help to determine the correct datatype for your
# columns. This is because Polars scans first N rows to determine correct dtype
exposures = pl.read_csv("./data/frtb/Delta.csv", dtypes={"SensitivitySpot": pl.Float64})
# Feel free to join other attributes such as Hierarchy here ...
ds = ul.FRTBDataSet.from_frame(exposures)

original = ds.frame()  # keep the old value for comparison

ds.prepare()

prepared = ds.frame()


# Let's see what happened
def diff(df1: pl.DataFrame, df2: pl.DataFrame) -> pl.DataFrame:
    """Columns in df1 which are not in df2

    Args:
        df1 (pl.DataFrame): First to compare
        df2 (pl.DataFrame): Second to compare

    Returns:
        pl.DataFrame: _description_
    """
    return df1.select([c for c in df1 if c.name not in df2])


diff_frame = diff(prepared, original)
print(diff_frame.columns)
You will get an error if you try to assign twice. Now, let's see what happened. We will need a little helper function:
At the time of writing this returns 6 new columns(names of the columns might change slightly but the meaning will always be the same):
| Column Name | Explanation |
|---|---|
| SensWeights | List of weights, one for each tenor. Eg [1,1,1,1,1] for any Vega risk. |
| CurvatureRiskWeight | Simply max of SensWeights if PnL Up or Down was provided, otherwise NULL. This is how we identify Curvature eligible trades. |
| SensWeightsCRR2 | Same as SensWeights but under CRR2 rules. |
| CurvatureRiskWeightCRR2 | Same logic as BCBS |
| ScaleFactor | DRC scailing: yearfrac between COB and MaturityDate |
| SeniorityRank | Mapping used internaly for DRC offsetting |
Calculation
Before you run
Before you specify what you want to calculate make sure the measure/risk metric you are interested in is present in the dataset:
print( ds.measures )
What you get there is a dict. The keys are measures' name. For example SensitivitySpot or FX DeltaCharge Low. The items indicate if there is any restriction on aggregation method, where scalar is a special method explained below. If None, you are free to use any of the availiable:
print( ul.aggregation_ops() )
Note that any numeric column automatically considered a measure (eg SensitivitySpot). These measures can be aggregated any way you want for a given level, say Desk. In other words, for a given Desk you can find the mean, max, min or sum (etc etc) of SensitivitySpot. On the other hand, you can not find mean, max, min (etc etc) of FX DeltaCharge Low. This wouldn't make sence since FX DeltaCharge Low is simply a single number defined by the regulation. Hence we call such aggregation method scalar and we restrict you to use only this method.
Also, make sure that columns which appear in measures, grouby and filters are present as well.
Run
Now we are good to form the request which we need. Say, we want to understand the DRC capital charge and all intermediate results, for every combination of Desk - BucketBCBS.
# What do we want to calculate?
request = dict(
    measures=[
        ["DRC nonSec GrossJTD", "sum"],
        ["DRC nonSec GrossJTD Scaled", "sum"],
        ["DRC nonSec CapitalCharge", "scalar"],
        ["DRC nonSec NetLongJTD", "scalar"],
        ["DRC nonSec NetShortJTD", "scalar"],
        ["DRC nonSec NetLongJTD Weighted", "scalar"],
        ["DRC nonSec NetAbsShortJTD Weighted", "scalar"],
        ["DRC nonSec HBR", "scalar"],
    ],
    groupby=["Desk", "BucketBCBS"],
    hide_zeros=True,
    calc_params={
        "jurisdiction": "BCBS",
        "apply_fx_curv_div": "true",
        "drc_offset": "true",
    },
)
Note: if you don't care about level of aggregation and just want a total say DRC Capital Charge for your portfolio, just provide an extra column to your portfolio, name it "Total"(for exmaple) and set all values in the columns as "Total". Then do groupby=["Total"]. Above request has two optional parameters which we haven't talked about yet: hide_zeros and calc_params. hide_zeros simply removes rows from the result where each measure is 0, and calc_params allows you to override default parameters such as jurisdiction, reporting_ccy, girr_delta_rho_diff_curve_base (and many many others. We will talk about in analysis chapter) etc.
Valide that you've formed a legitimate request (ie no compulsory field is missing, datatypes are correct etc):
aggrequest = ul.AggRequest(request)
print(request)
Finally, to execute
result = ds.compute(request)
print(result)
print("Type: ", type(result))
Notice the returned object is a polars DataFrame. You can then do whatever you want with it. Print (to set how many columns you want to print make sure to use polars config), or any on the I/O: save to csv, parquet, database etc.
FRTB Supported measures
At the time of writing:
ds = ul.FRTBDataSet.from_frame(df)
for m in ds.measures.keys():
    print(m)
CSR Sec CTP CVRdown
CSR Sec CTP CVRup
CSR Sec CTP Curvature Kb High
CSR Sec CTP Curvature Kb Low
CSR Sec CTP Curvature Kb Medium
CSR Sec CTP Curvature KbMinus High
CSR Sec CTP Curvature KbMinus Low
CSR Sec CTP Curvature KbMinus Medium
CSR Sec CTP Curvature KbPlus High
CSR Sec CTP Curvature KbPlus Low
CSR Sec CTP Curvature KbPlus Medium
CSR Sec CTP Curvature Sb High
CSR Sec CTP Curvature Sb Low
CSR Sec CTP Curvature Sb Medium
CSR Sec CTP CurvatureCharge High
CSR Sec CTP CurvatureCharge Low
CSR Sec CTP CurvatureCharge MAX
CSR Sec CTP CurvatureCharge Medium
CSR Sec CTP CurvatureDelta
CSR Sec CTP CurvatureDelta_Weighted
CSR Sec CTP DeltaCharge High
CSR Sec CTP DeltaCharge Low
CSR Sec CTP DeltaCharge MAX
CSR Sec CTP DeltaCharge Medium
CSR Sec CTP DeltaKb High
CSR Sec CTP DeltaKb Low
CSR Sec CTP DeltaKb Medium
CSR Sec CTP DeltaSb
CSR Sec CTP DeltaSens
CSR Sec CTP DeltaSens Weighted
CSR Sec CTP PnLdown
CSR Sec CTP PnLup
CSR Sec CTP TotalCharge High
CSR Sec CTP TotalCharge Low
CSR Sec CTP TotalCharge Medium
CSR Sec CTP VegaCharge High
CSR Sec CTP VegaCharge Low
CSR Sec CTP VegaCharge MAX
CSR Sec CTP VegaCharge Medium
CSR Sec CTP VegaKb High
CSR Sec CTP VegaKb Low
CSR Sec CTP VegaKb Medium
CSR Sec CTP VegaSb
CSR Sec CTP VegaSens
CSR Sec CTP VegaSens Weighted
CSR Sec nonCTP CVRdown
CSR Sec nonCTP CVRup
CSR Sec nonCTP Curvature Kb High
CSR Sec nonCTP Curvature Kb Low
CSR Sec nonCTP Curvature Kb Medium
CSR Sec nonCTP Curvature KbMinus High
CSR Sec nonCTP Curvature KbMinus Low
CSR Sec nonCTP Curvature KbMinus Medium
CSR Sec nonCTP Curvature KbPlus High
CSR Sec nonCTP Curvature KbPlus Low
CSR Sec nonCTP Curvature KbPlus Medium
CSR Sec nonCTP Curvature Sb High
CSR Sec nonCTP Curvature Sb Low
CSR Sec nonCTP Curvature Sb Medium
CSR Sec nonCTP CurvatureCharge High
CSR Sec nonCTP CurvatureCharge Low
CSR Sec nonCTP CurvatureCharge MAX
CSR Sec nonCTP CurvatureCharge Medium
CSR Sec nonCTP CurvatureDelta
CSR Sec nonCTP CurvatureDelta Weighted
CSR Sec nonCTP DeltaCharge High
CSR Sec nonCTP DeltaCharge Low
CSR Sec nonCTP DeltaCharge MAX
CSR Sec nonCTP DeltaCharge Medium
CSR Sec nonCTP DeltaKb High
CSR Sec nonCTP DeltaKb Low
CSR Sec nonCTP DeltaKb Medium
CSR Sec nonCTP DeltaSb
CSR Sec nonCTP DeltaSens
CSR Sec nonCTP DeltaSens Weighted
CSR Sec nonCTP PnLdown
CSR Sec nonCTP PnLup
CSR Sec nonCTP TotalCharge High
CSR Sec nonCTP TotalCharge Low
CSR Sec nonCTP TotalCharge Medium
CSR Sec nonCTP VegaCharge High
CSR Sec nonCTP VegaCharge Low
CSR Sec nonCTP VegaCharge MAX
CSR Sec nonCTP VegaCharge Medium
CSR Sec nonCTP VegaKb High
CSR Sec nonCTP VegaKb Low
CSR Sec nonCTP VegaKb Medium
CSR Sec nonCTP VegaSb
CSR Sec nonCTP VegaSens
CSR Sec nonCTP VegaSens Weighted
CSR nonSec CVRdown
CSR nonSec CVRup
CSR nonSec Curvature Kb High
CSR nonSec Curvature Kb Low
CSR nonSec Curvature Kb Medium
CSR nonSec Curvature KbMinus High
CSR nonSec Curvature KbMinus Low
CSR nonSec Curvature KbMinus Medium
CSR nonSec Curvature KbPlus High
CSR nonSec Curvature KbPlus Low
CSR nonSec Curvature KbPlus Medium
CSR nonSec Curvature Sb High
CSR nonSec Curvature Sb Low
CSR nonSec Curvature Sb Medium
CSR nonSec CurvatureCharge High
CSR nonSec CurvatureCharge Low
CSR nonSec CurvatureCharge MAX
CSR nonSec CurvatureCharge Medium
CSR nonSec CurvatureDelta
CSR nonSec CurvatureDeltaWeighted
CSR nonSec DeltaCharge High
CSR nonSec DeltaCharge Low
CSR nonSec DeltaCharge MAX
CSR nonSec DeltaCharge Medium
CSR nonSec DeltaKb High
CSR nonSec DeltaKb Low
CSR nonSec DeltaKb Medium
CSR nonSec DeltaSb
CSR nonSec DeltaSens
CSR nonSec DeltaSens Weighted
CSR nonSec PnLdown
CSR nonSec PnLup
CSR nonSec TotalCharge High
CSR nonSec TotalCharge Low
CSR nonSec TotalCharge MAX
CSR nonSec TotalCharge Medium
CSR nonSec VegaCharge High
CSR nonSec VegaCharge Low
CSR nonSec VegaCharge MAX
CSR nonSec VegaCharge Medium
CSR nonSec VegaKb High
CSR nonSec VegaKb Low
CSR nonSec VegaKb Medium
CSR nonSec VegaSb
CSR nonSec VegaSens
CSR nonSec VegaSens Weighted
Commodity CVRdown
Commodity CVRup
Commodity Curvature Kb High
Commodity Curvature Kb Low
Commodity Curvature Kb Medium
Commodity Curvature KbMinus High
Commodity Curvature KbMinus Low
Commodity Curvature KbMinus Medium
Commodity Curvature KbPlus High
Commodity Curvature KbPlus Low
Commodity Curvature KbPlus Medium
Commodity Curvature Sb High
Commodity Curvature Sb Low
Commodity Curvature Sb Medium
Commodity CurvatureCharge High
Commodity CurvatureCharge Low
Commodity CurvatureCharge MAX
Commodity CurvatureCharge Medium
Commodity CurvatureDelta
Commodity CurvatureDelta Weighted
Commodity DeltaCharge High
Commodity DeltaCharge Low
Commodity DeltaCharge MAX
Commodity DeltaCharge Medium
Commodity DeltaKb High
Commodity DeltaKb Low
Commodity DeltaKb Medium
Commodity DeltaSb
Commodity DeltaSens
Commodity DeltaSens Weighted
Commodity PnLdown
Commodity PnLup
Commodity TotalCharge High
Commodity TotalCharge Low
Commodity TotalCharge MAX
Commodity TotalCharge Medium
Commodity VegaCharge High
Commodity VegaCharge Low
Commodity VegaCharge MAX
Commodity VegaCharge Medium
Commodity VegaKb High
Commodity VegaKb Low
Commodity VegaKb Medium
Commodity VegaSb
Commodity VegaSens
Commodity VegaSens Weighted
DRC Charge
DRC Sec nonCTP CapitalCharge
DRC Sec nonCTP GrossJTD
DRC Sec nonCTP GrossJTD Scaled
DRC Sec nonCTP HBR
DRC Sec nonCTP NetLongJTD
DRC Sec nonCTP NetLongJTD Weighted
DRC Sec nonCTP NetShortJTD
DRC Sec nonCTP NetShortJTD Weighted
DRC nonSec CapitalCharge
DRC nonSec GrossJTD
DRC nonSec GrossJTD Scaled
DRC nonSec HBR
DRC nonSec NetAbsShortJTD Weighted
DRC nonSec NetLongJTD
DRC nonSec NetLongJTD Weighted
DRC nonSec NetShortJTD
EQ CVRdown
EQ CVRup
EQ Curvature Kb High
EQ Curvature Kb Low
EQ Curvature Kb Medium
EQ Curvature KbMinus High
EQ Curvature KbMinus Low
EQ Curvature KbMinus Medium
EQ Curvature KbPlus High
EQ Curvature KbPlus Low
EQ Curvature KbPlus Medium
EQ Curvature Sb High
EQ Curvature Sb Low
EQ Curvature Sb Medium
EQ CurvatureCharge High
EQ CurvatureCharge Low
EQ CurvatureCharge MAX
EQ CurvatureCharge Medium
EQ CurvatureDelta
EQ CurvatureDelta_Weighted
EQ DeltaCharge High
EQ DeltaCharge Low
EQ DeltaCharge MAX
EQ DeltaCharge Medium
EQ DeltaKb High
EQ DeltaKb Low
EQ DeltaKb Medium
EQ DeltaSb
EQ DeltaSens
EQ DeltaSens Weighted
EQ PnLdown
EQ PnLup
EQ TotalCharge High
EQ TotalCharge Low
EQ TotalCharge Medium
EQ VegaCharge High
EQ VegaCharge Low
EQ VegaCharge MAX
EQ VegaCharge Medium
EQ VegaKb High
EQ VegaKb Low
EQ VegaKb Medium
EQ VegaSb
EQ VegaSens
EQ VegaSens Weighted
Exotic RRAO Charge
Exotic RRAO Notional
FX CVRdown
FX CVRup
FX Curvature Kb
FX Curvature KbMinus
FX Curvature KbPlus
FX Curvature Sb
FX CurvatureCharge High
FX CurvatureCharge Low
FX CurvatureCharge MAX
FX CurvatureCharge Medium
FX CurvatureDelta
FX CurvatureDelta Weighted
FX DeltaCharge High
FX DeltaCharge Low
FX DeltaCharge MAX
FX DeltaCharge Medium
FX DeltaKb
FX DeltaSb
FX DeltaSens
FX DeltaSens Weighted
FX PnLdown
FX PnLup
FX TotalCharge High
FX TotalCharge Low
FX TotalCharge Medium
FX VegaCharge High
FX VegaCharge Low
FX VegaCharge MAX
FX VegaCharge Medium
FX VegaKb High
FX VegaKb Low
FX VegaKb Medium
FX VegaSb
FX VegaSens
FX VegaSens Weighted
GIRR CVRdown
GIRR CVRup
GIRR Curvature Kb
GIRR Curvature KbMinus
GIRR Curvature KbPlus
GIRR Curvature Sb
GIRR CurvatureCharge High
GIRR CurvatureCharge Low
GIRR CurvatureCharge MAX
GIRR CurvatureCharge Medium
GIRR CurvatureDelta
GIRR CurvatureDelta Weighted
GIRR DeltaCharge High
GIRR DeltaCharge Low
GIRR DeltaCharge MAX
GIRR DeltaCharge Medium
GIRR DeltaKb High
GIRR DeltaKb Low
GIRR DeltaKb Medium
GIRR DeltaSb
GIRR DeltaSens
GIRR DeltaSens Weighted
GIRR PnLdown
GIRR PnLup
GIRR TotalCharge High
GIRR TotalCharge Low
GIRR TotalCharge Medium
GIRR VegaCharge High
GIRR VegaCharge Low
GIRR VegaCharge MAX
GIRR VegaCharge Medium
GIRR VegaKb High
GIRR VegaKb Low
GIRR VegaKb Medium
GIRR VegaSb
GIRR VegaSens
GIRR VegaSens Weighted
GrossJTD
Other RRAO Charge
Other RRAO Notional
PnL_Down
PnL_Up
RRAO Charge
RiskWeights
SA Charge
SBM Charge
SBM Charge High
SBM Charge Low
SBM Charge Medium
SensitivitySpot
Sensitivity_025Y
Sensitivity_05Y
Sensitivity_10Y
Sensitivity_1Y
Sensitivity_3Y
Sensitivity_5Y
Total Sens
TradeId
What If
This chapter demonstrates all the rich feature selection ultibi offers for your analysis. For instance, you can override risk weights, inner/across bucket correlation parameters, trade attributes.
You can instantly add rows(trades) to your portfolio to analyse the impact it has on the cpaital charge.
We also provide a wide range of optional calculation parameters(such as jurisdiction, etc) which you could chose when performing calculation.
Filtering
Often, one would want filter their data. May be you are just interested in number of one particular subset (eg a Book). Or, if you are investigating an issue, this can be very useful to narrow down the potential underlying root cause.
Note: you specify type of filter with "op" argument.
Equal (Eq)
In this example we breakdown by Country and RiskClass. We also filter on Desk == FXOptions.
import ultibi as ul
import polars as pl

pl.Config.set_tbl_rows(100)
ds = ul.FRTBDataSet.from_config_path("./data/frtb/datasource_config.toml")


request = dict(
    measures=[["SBM Charge", "scalar"]],
    groupby=["Country", "RiskClass"],
    filters=[[{"op": "Eq", "field": "Desk", "value": "FXOptions"}]],
    hide_zeros=True,
    totals=True,
    calc_params={
        "jurisdiction": "BCBS",
        "apply_fx_curv_div": "true",
        "drc_offset": "true",
    },
)
result = ds.compute(request)
print(result)
Not Equial (Neq)
In this example we breakdown by Country and RiskClass. We also filter on Desk != FXOptions.
request = dict(
    measures=[["SBM Charge", "scalar"]],
    groupby=["Country", "RiskClass"],
    filters=[[{"op": "Neq", "field": "Desk", "value": "FXOptions"}]],
    hide_zeros=True,
    totals=True,
    calc_params={
        "jurisdiction": "BCBS",
        "apply_fx_curv_div": "true",
        "drc_offset": "true",
    },
)
result = ds.compute(request)
print(result)
In (In)
In is similar to Eq, but instead of one value you can provide multiple. In this example we filter on Desk to be FXOptions or Rates.
request = dict(
    measures=[["SBM Charge", "scalar"]],
    groupby=["Country", "RiskClass"],
    filters=[[{"op": "In", "field": "Desk", "value": ["FXOptions", "Rates"]}]],
    hide_zeros=True,
    totals=True,
    calc_params={
        "jurisdiction": "BCBS",
        "apply_fx_curv_div": "true",
        "drc_offset": "true",
    },
)
result = ds.compute(request)

print(result)
Not In (NotIn)
NotIn is similar to Neq, but instead of saying that column value should not be equal to A, you can say that it should not be equal neither to A not to B. In this example we filter on Desk not being one of FXOptions or Rates.
request = dict(
    measures=[["SBM Charge", "scalar"]],
    groupby=["Country", "RiskClass"],
    filters=[[{"op": "NotIn", "field": "Desk", "value": ["FXOptions", "Rates"]}]],
    hide_zeros=True,
    totals=True,
    calc_params={
        "jurisdiction": "BCBS",
        "apply_fx_curv_div": "true",
        "drc_offset": "true",
    },
)
result = ds.compute(request)

print(result)
Combining Filters
You can combine filters as much as you want. In all the previous examples notice that filter. Is a nested list, ie a list of lists. It is important to keep in mind that inner filters of each list will be joined as OR, while outer filters will be joined as AND. For example, here we want LegalEntity to be equal to EMEA OR Country to be UK, AND we also want RiskClass either FX or Equity.
request = dict(
    measures=[["SBM Charge", "scalar"]],
    groupby=["Country", "RiskClass"],
    filters=[
        [
            {"op": "Eq", "field": "LegalEntity", "value": "EMEA"},
            {"op": "Eq", "field": "Country", "value": "UK"},
        ],
        [{"op": "In", "field": "RiskClass", "value": ["FX", "Equity"]}],
    ],
    hide_zeros=True,
    totals=True,
    calc_params={
        "jurisdiction": "BCBS",
        "apply_fx_curv_div": "true",
        "drc_offset": "true",
    },
)
result = ds.compute(request)
print(result)
Overrides
You can temporarily override any value in your dataset. This can be very useful to perform analysis. An override consists of three fields:
- The Field (ie the column where you seek to override values). Note: at the time of writing you can only override bool, str, number, list of numbers types of columns.
- The New Value.
- The Filters. ie when to override the existing with the new value.
Let's do a couple of examples. Notice that under BCBS page 59 table 2. the default risk weight is almost the same as under CRR2. Assuming that AA is Credit Quality Step 1, if we change the risk weight to 0.005 we would expect to get the same outcome. Let's test this out:
request = dict(
    filters=[],
    groupby=["RiskClass", "Desk"],
    overrides=[
        {
            "field": "SensWeights",
            "value": "[0.005]",
            "filters": [
                [{"op": "Eq", "field": "RiskClass", "value": "DRC_nonSec"}],
                [{"op": "Eq", "field": "CreditQuality", "value": "AA"}],
            ],
        }
    ],
    measures=[["DRC nonSec CapitalCharge", "scalar"]],
    hide_zeros=True,
    calc_params={
        "jurisdiction": "BCBS",
        "drc_offset": "false",
    },
)
result = ds.compute(request)

request = dict(
print(result)
Note that SensWeights is a list of numbers column (because of multiple tenors) and therefore we write it as a list [0.005].
Let's compare this to a run without overrides but with jurisdiction == CRR2:
request = dict(
    filters=[],
    groupby=["RiskClass", "Desk"],
    measures=[["DRC nonSec CapitalCharge", "scalar"]],
    hide_zeros=True,
    calc_params={
        "jurisdiction": "CRR2",
        "drc_offset": "false",
    },
)
result = ds.compute(request)
print(result)
Results should match!
Add Rows
ultibi's request suppors adding rows(in our case Trades). This is a perfect functionality to have in your toolset, especially for a super quick What If analysis.
Examples
An example of a request with add_row looks like this:
import ultibi as ul
import json

ds = ul.FRTBDataSet.from_config_path("./data/frtb/datasource_config.toml")

added_rows = dict(
    prepare=True,
    rows=[
        {
            "SensitivitySpot": "1000000",
            "PnL_Up": "0",
            "PnL_Down": "0",
            "COB": "",
            "MaturityDate": "",
            "RiskClass": "Commodity",
            "RiskFactor": "XAU",
            "RiskCategory": "Delta",
            "RiskFactorType": "",
            "BucketBCBS": "7",
            "BucketCRR2": "7",
            "CreditQuality": "",
            "CoveredBondReducedWeight": "",
            "Group": "Ultima",
        }
    ],
)

added_rows_json = json.dumps(added_rows)

request1 = dict(
    measures=[
        ["Commodity DeltaCharge Low", "scalar"],
        ["Commodity DeltaCharge Medium", "scalar"],
        ["Commodity DeltaCharge High", "scalar"],
    ],
    add_row=added_rows,
    groupby=["Group"],
    hide_zeros=True,
)

result1 = ds.compute(request1)

# print(result1) #<-- uncomment to see

# Now, just for comparison - run metrics without and additional trades
request2 = dict(
    measures=[
        ["Commodity DeltaCharge Low", "scalar"],
        ["Commodity DeltaCharge Medium", "scalar"],
        ["Commodity DeltaCharge High", "scalar"],
    ],
    groupby=["Group"],
    hide_zeros=True,
)

result2 = ds.compute(request2)
print(result1)
print(result2)
Explanation
If you set prepare to true be prepared to provide all the required columns to assign weights.
Calc Params
ultibi allows you to override parameters of the regulation, which in turn allows you to define your own parameter sets. For example if a regulatory set is not yet supported - just override parameters which are different in "calc_params" part of your request.
What you can override
Use .calc_params attribute to get the list of overridable parameters.
for calc_param in dataset.calc_params:
    print(calc_param["name"], " - ", calc_param["hint"])
Explanation
Most of these are self explanatory. However, one needs to understand what exactly some of those do:
-
Some calc_params end with _base and some with _low/_medium/_high. Those which end with _base (eg.
com_delta_rho_diff_loc_base) are components of an actual rho. For examplecom_delta_rho_diff_loc_baseis (a float) and is part of three components which are multiplied to produce a commodity inner bucket rho as per21.83.3. This has one important implication. Low/High function as per paragraph21.6in the text will be applied after this multiplication. On the other hand, those calc_params which end with _low/_medium/_high (eggirr_delta_gamma_low) will be used as they are. -
Those calc_params (eg
com_delta_diff_cty_rho_per_bucket_base) which are lists are usually per bucket, where index of the item indicates the number of the bucket. -
jurisdiction- currentlyBCBSorCRR2- points to which parameter set (rhos, gammas etc) to be used by default. Also for FX ifreporting_ccyis not provided -
reporting_ccy- used for FX. Only those FX delta/curvature sensitivites where RiskFactor is XXXCCY (where CCY is the reporting_ccy) will be used for calculation. (eg if reporting_ccy is USD, GBPUSD will be used, but GBPEUR will not - this applies for Delta and Curvature calculations only). -
For gamma correlation matrixes the diagonal has to be 0.
-
You have to be very careful with the way to provide a
calc_paramin your request, especially for vectors and matrixes. Usejson.dumpsfor calc_params. Follow examples below. 'v' is always 1.
Examples
A request with calc_params looks like this. This is an arbitrary example just for illustrative purposes:
import ultibi as ul
import json

ds = ul.FRTBDataSet.from_config_path("./data/frtb/datasource_config.toml")

for calc_param in ds.calc_params:
    if "com_delta_" in calc_param[0]:
        # print(calc_param) #<-- uncomment to see
        pass
# fmt: off
com_delta_diff_cty_rho_per_bucket_base = json.dumps(
    [1.55, 1.95, 1.4, 1.8, 1.6, 1.65, 1.55, 1.45, 1.15, 1.4, 1.15]
)
com_delta_gamma_low = json.dumps(
    {
        "v": 1,
        "dim": [11, 11],
        "data": [
            0.0,1.2,1.2,1.2,1.2,1.2,1.2,1.2,1.2,1.2,0.0,
            1.2,0.0,1.2,1.2,1.2,1.2,1.2,1.2,1.2,1.2,0.0,
            1.2,1.2,0.0,1.2,1.2,1.2,1.2,1.2,1.2,1.2,0.0,
            1.2,1.2,1.2,0.0,1.2,1.2,1.2,1.2,1.2,1.2,0.0,
            1.2,1.2,1.2,1.2,0.0,1.2,1.2,1.2,1.2,1.2,0.0,
            1.2,1.2,1.2,1.2,1.2,0.0,1.2,1.2,1.2,1.2,0.0,
            1.2,1.2,1.2,1.2,1.2,1.2,0.0,1.2,1.2,1.2,0.0,
            1.2,1.2,1.2,1.2,1.2,1.2,1.2,0.0,1.2,1.2,0.0,
            1.2,1.2,1.2,1.2,1.2,1.2,1.2,1.2,0.0,1.2,0.0,
            1.2,1.2,1.2,1.2,1.2,1.2,1.2,1.2,1.2,0.0,0.0,
            0.0,0.0,0.0,0.0,0.0,0.0,0.0,0.0,0.0,0.0,0.0,
        ],
    }
)
# fmt: on
calc_params = dict(
    com_delta_diff_cty_rho_per_bucket_base=com_delta_diff_cty_rho_per_bucket_base,
    com_delta_gamma_low=com_delta_gamma_low,
)
print(calc_params)

request1 = dict(
    measures=[
        ["Commodity DeltaCharge Low", "scalar"],
        ["Commodity DeltaCharge Medium", "scalar"],
        ["Commodity DeltaCharge High", "scalar"],
    ],
    groupby=["Group"],
    hide_zeros=True,
    calc_params=calc_params,
)

result1 = ds.compute(request1)

# print(result1) #<-- uncomment to see

request2 = dict(
    measures=[
        ["Commodity DeltaCharge Low", "scalar"],
        ["Commodity DeltaCharge Medium", "scalar"],
        ["Commodity DeltaCharge High", "scalar"],
    ],
    groupby=["Group"],
    hide_zeros=True,
)

result2 = ds.compute(request2)

# print(result2) #<-- uncomment to see
print(result1)
print(result2)
If a parameters could not get parsed
Currently, if your passed calc_param could not get parsed into a correct value (eg you provided float instead of a vector) - it will silently fall back to the defaulted value of the jurisdiction. This will be changed in the next release to return an error to avoid ambiguity.
UI
ultibi's provides a user friendly interface of your dataset and allows you to perform analysis live - without need to write any further code.
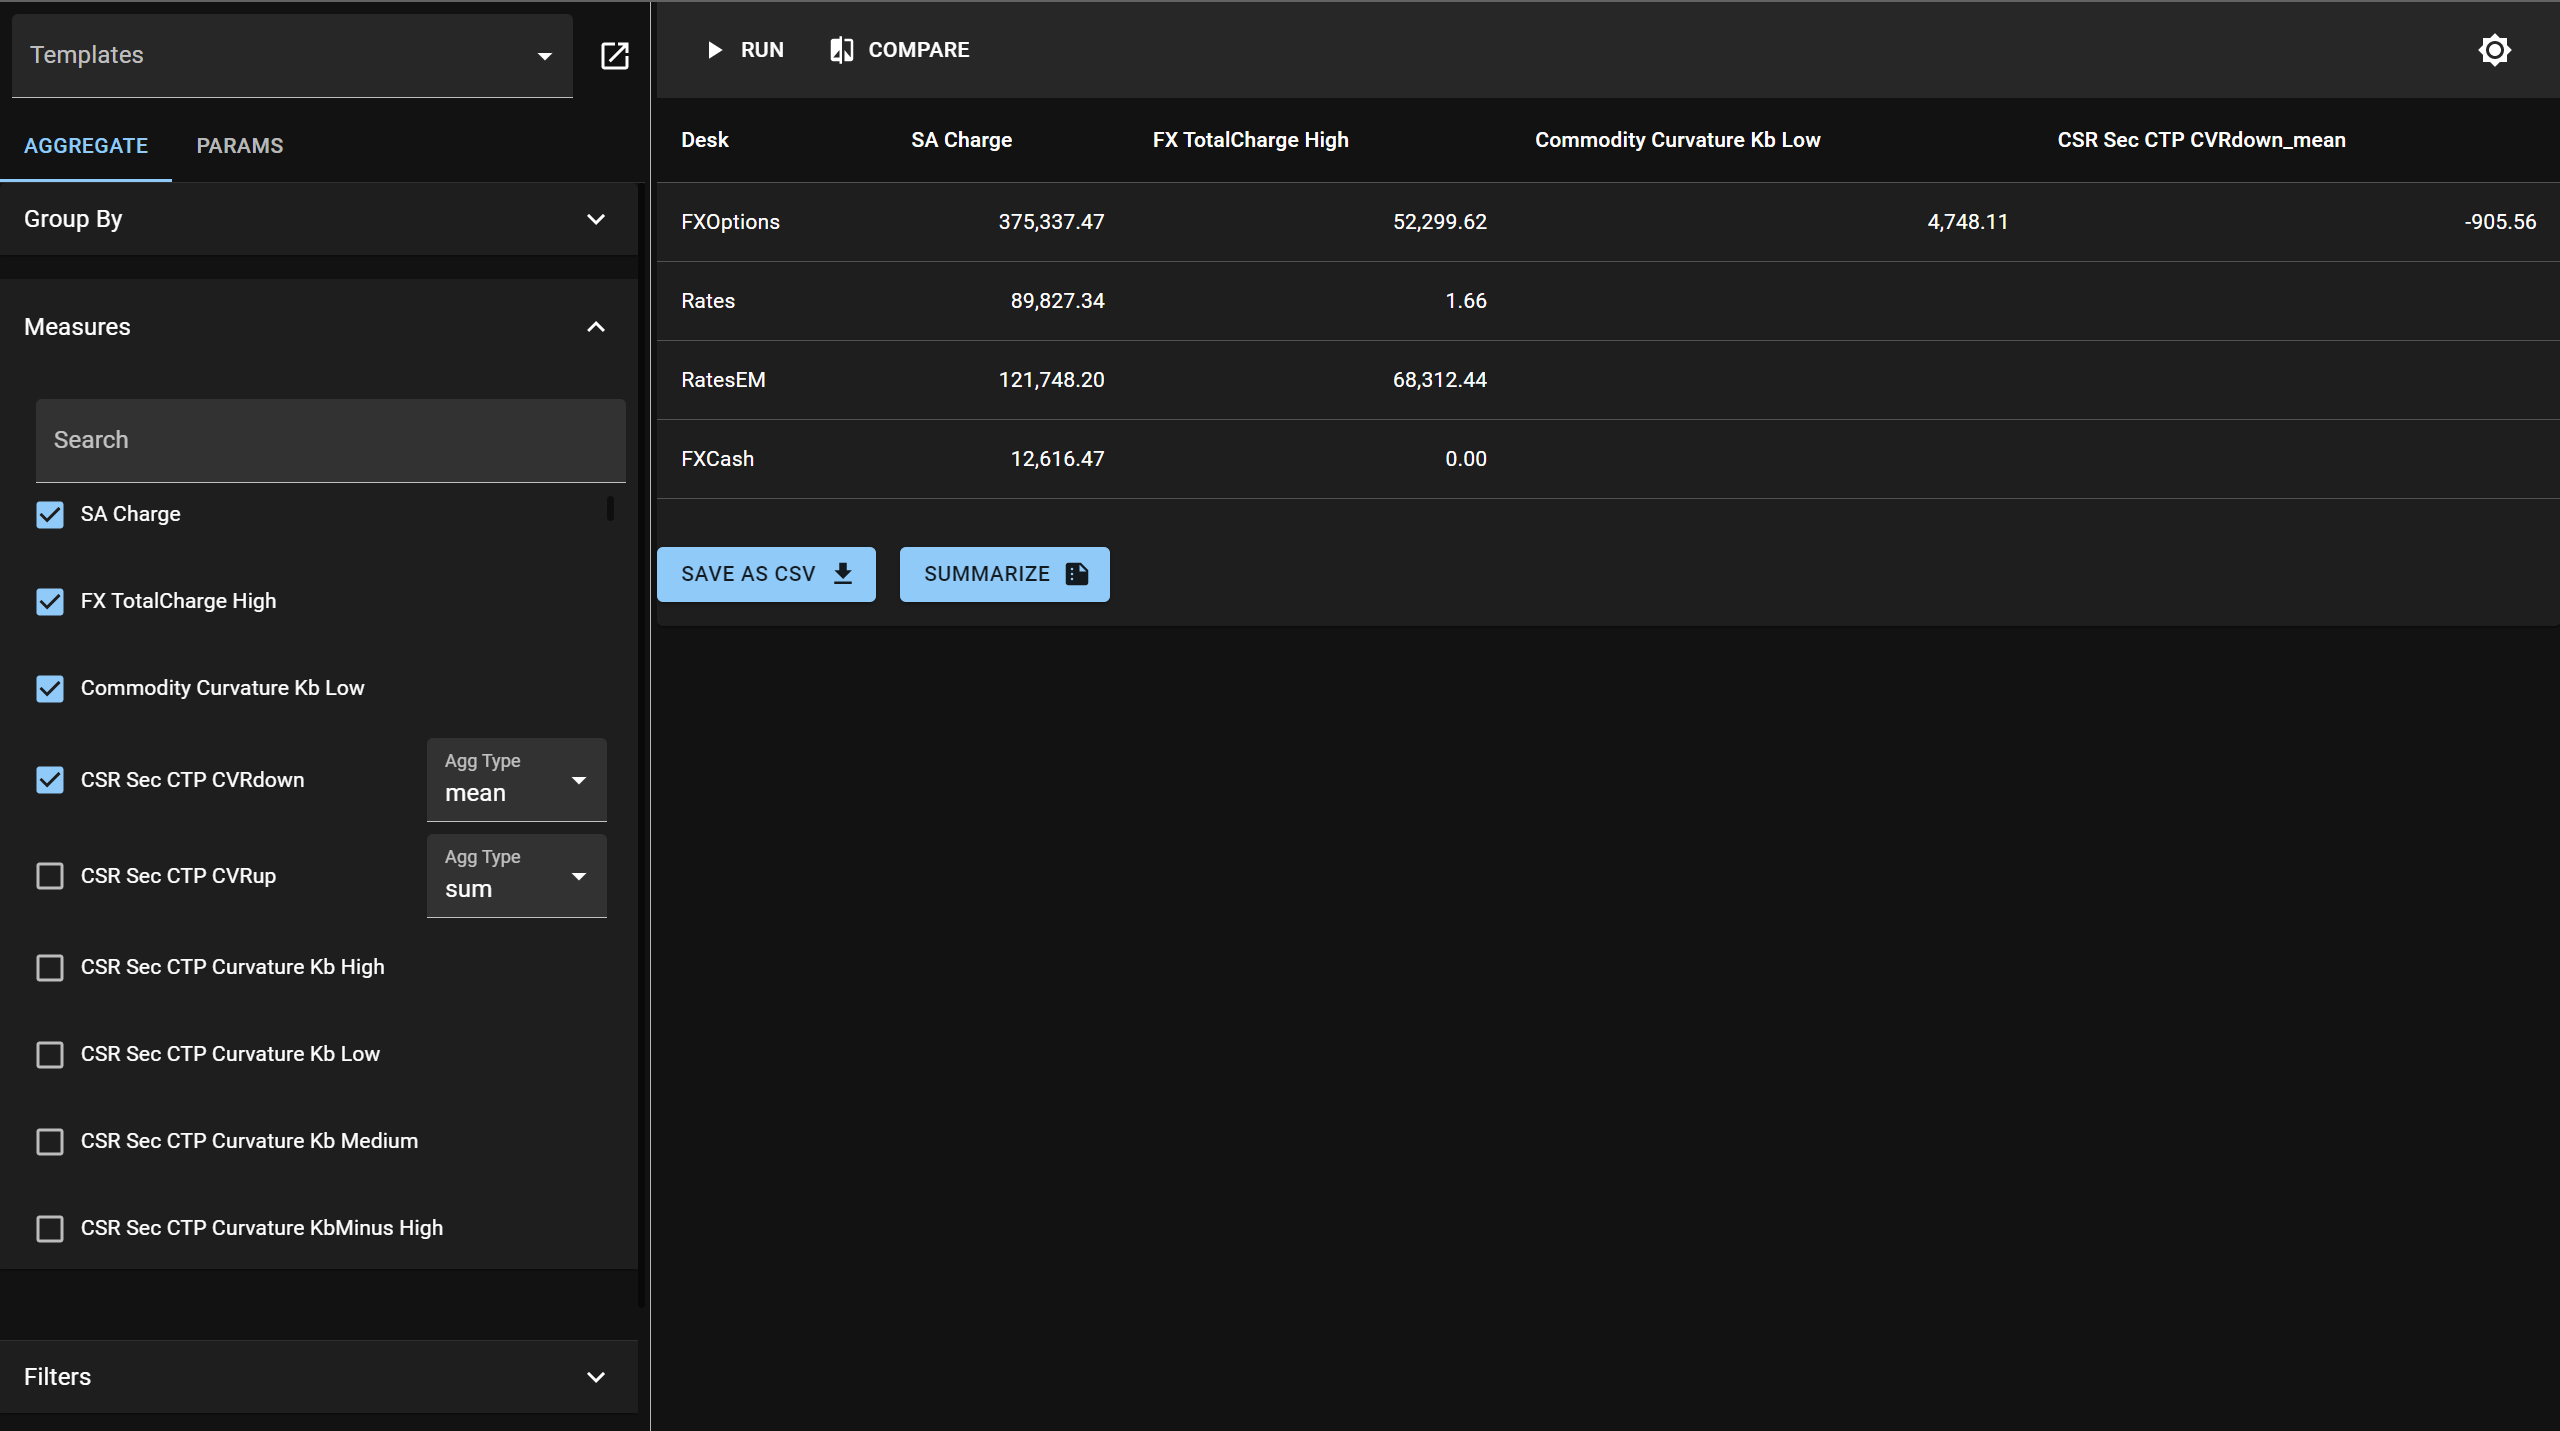
To achieve this simply call .ui() method on your dataset:
import ultibi as ul
import time
import os

os.environ["RUST_LOG"] = "info"
os.environ["ADDRESS"] = "0.0.0.0:8000"

start_time = time.time()
ds = ul.FRTBDataSet.from_config_path("./data/frtb/datasource_config.toml")
print("--- Read DF time: %s seconds ---" % (time.time() - start_time))
ds.ui()
Performance
ultibi FRTB aggregator was built with performance in mind. Bellow table summarizes a large Equity portfolio:
┌───────────┬──────────────┬────────────────┬───────────────┬──────────────┬─────────────────────┬─────────────────────┬─────────────────────────┐
│ RiskClass ┆ RiskCategory ┆ RiskFactorType ┆ TradeId_count ┆ PnL_Up_count ┆ BucketBCBS_n_unique ┆ RiskFactor_n_unique ┆ RiskFactorType_n_unique │
│ ---       ┆ ---          ┆ ---            ┆ ---           ┆ ---          ┆ ---                 ┆ ---                 ┆ ---                     │
│ str       ┆ str          ┆ str            ┆ u32           ┆ u32          ┆ u32                 ┆ u32                 ┆ u32                     │
╞═══════════╪══════════════╪════════════════╪═══════════════╪══════════════╪═════════════════════╪═════════════════════╪═════════════════════════╡
│ Equity    ┆ Delta        ┆ EqSpot         ┆ 648506        ┆ 648506       ┆ 4                   ┆ 18316               ┆ 1                       │
│ Equity    ┆ Delta        ┆ EqRepo         ┆ 219792        ┆ 219792       ┆ 3                   ┆ 18316               ┆ 1                       │
└───────────┴──────────────┴────────────────┴───────────────┴──────────────┴─────────────────────┴─────────────────────┴─────────────────────────┘
This portfolio consist of 868298 Equity Delta and Curvature (see PnL_Up_count) Sensitivities splic across 4 buckets, 18316 risk factors(equity names/tickers), with both Spot and Repo Present.
The result as of ultibi v0.1.3: --- Read DF time: 483.5027ms --- --- Assign Weights time: 1.1574655s ---
Just single EQ Delta Charge:
request2 = dict(
    measures=[
        ["EQ DeltaCharge Medium", "scalar"]
    ],
    # Break down results by Group and BucketBCBS
    groupby=["Group"],

    # Show totals for each Group (note in this example only 1)
    totals = True,
    # Hide rows where each result is 0
    hide_zeros=True,
    calc_params={
        "jurisdiction": "BCBS",
        # Apply 21.98
        "apply_fx_curv_div": "true",
    },
)
--- Compute time: 0.22789788246154785 seconds ---
request2 = dict(
    measures=[
        ["SBM Charge", "scalar"]
    ],
    # Break down results by Group and BucketBCBS
    groupby=["Group"],

    # Show totals for each Group (note in this example only 1)
    totals = True,
    # Hide rows where each result is 0
    hide_zeros=True,
    calc_params={
        "jurisdiction": "BCBS",
        # Apply 21.98
        "apply_fx_curv_div": "true",
    },
)
--- Compute No Deps time: 2.538625478744507 seconds ---
Caching
Note, thanks to ultibi's internal caching mechanism, basic measures can be reused. For example:
request = dict(
    measures=[
        ["SBM Charge High", "scalar"],
        ["SBM Charge Low", "scalar"],
        ["SBM Charge Medium", "scalar"]
    ],
    # Break down results by Group and BucketBCBS
    groupby=["Group"],

    # Show totals for each Group (note in this example only 1)
    totals = True,
    # Hide rows where each result is 0
    hide_zeros=True,
    calc_params={
        "jurisdiction": "BCBS",
        # Apply 21.98
        "apply_fx_curv_div": "true",
    },
)
--- Compute No Deps time: 0.010367870330810547 seconds ---
Compute time is almost identical to that of request2. This is because SBM Charge is a simple max of SBM Charge Low, SBM Charge Medium, SBM Charge High and therefore almost no additional compute is required.
DataSet cache stores results of basic measures such as EQ DeltaCharge Medium. Therefore the next request will reuse them.
Standing on the shoulders of a giant: Polars
We use Polars in the backend, one of the fastest DataBase/DataFrame like ops solutions out there. Read more about the benchmarks here to get a feel for how much data we can process and how fast.
Contacts and Feedback
ultibi was created by Ultima
Get in touch:
- Anatoly's LinkedIn
- Github
- Raise an issue or PR: Github Issues